Union Bank of India, a prominent player in the public sector banking industry, has recently undergone an evaluation revision reflecting its current market dynamics. The bank’s stock price is currently at 134.05, down from a previous close of 138.55, with a 52-week high of 158.60 and a low of 100.75. Today’s trading saw a high of 138.80 and a low of 133.85.
In terms of technical indicators, the bank’s performance shows a mixed picture. The MACD readings indicate a mildly bearish trend on both weekly and monthly bases, while the Bollinger Bands present a bearish outlook weekly but a bullish one monthly. The moving averages suggest a mildly bullish stance on a daily basis, contrasting with the bearish signals from the KST and Dow Theory on a weekly and monthly scale.
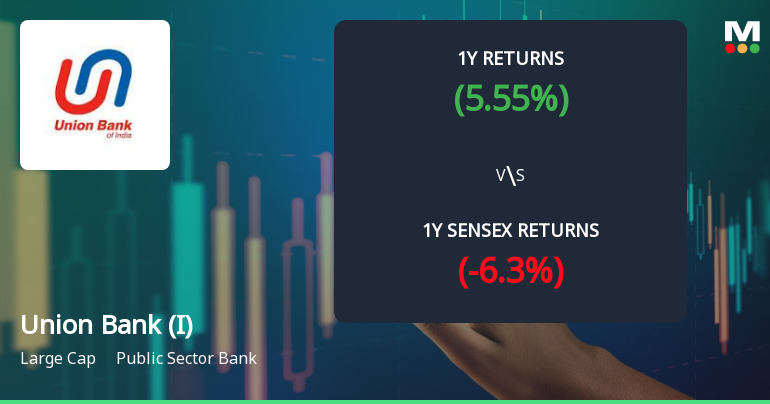
When comparing the bank’s returns to the Sensex, Union Bank has demonstrated notable resilience. Over the past year, it has achieved a return of 5.55%, while the Sensex has declined by 6.30%. Furthermore, the bank’s performance over three and five years is particularly striking, with returns of 216.16% and 452.78%, respectively, significantly outpacing the Sensex’s returns of 40.74% and 115.11% in the same periods. This evaluation adjustment highlights the bank’s ongoing adaptation to market conditions and its historical performance relative to broader market trends.


